
What Is a Force Plate? Jump Testing for Athlete Readiness
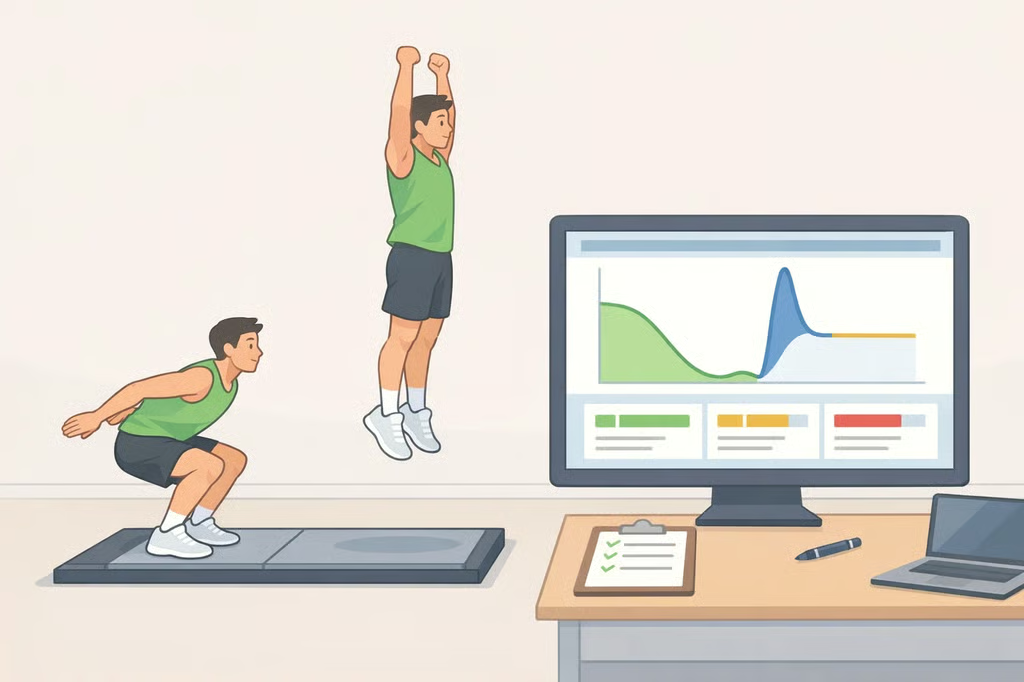
What is a force plate? It's a platform that measures ground-reaction force, the force an athlete produces against it, and converts that into a force-time curve rather than a single score (cross-platform comparison; jump height review). A force plate measures force-related outputs during a task; it doesn't by itself provide a complete measure of maximal strength, which requires separate testing protocols such as isometric strength pulls. Vertical jump tests appear in 82.5% of published research on sport-induced neuromuscular fatigue, and force platforms serve as the measurement tool in 77.5% of that research, according to a systematic review. For coaches, strength staff, and athletes watching countermovement jump (CMJ) numbers populate a report after every training block, force plate testing for athletes only helps if the person reading it knows what the number actually represents.
Two studies published within the past year illustrate why that number needs context. A study tracking 14 Division I women's volleyball players through a season, published earlier this year, found no meaningful link between daily workload spikes and next-morning CMJ scores. A separate study following elite girls' youth soccer players across eight matches, published last year, found statistically significant but trivial-to-small increases in jump height and selected force-time measures after matches, plus similar increases two days later, rather than the declines coaches often expect. Both describe a specific team, sport, and testing window; they show how much CMJ sensitivity depends on those factors rather than proving jump testing can't detect fatigue.
This guide covers what a force plate records, why vertical jump testing dominates fatigue research, why the same jump can produce different numbers depending on the system and settings, and how these two studies fit into that picture without overreacting to a single test result.
What is a force plate, and what does it measure?
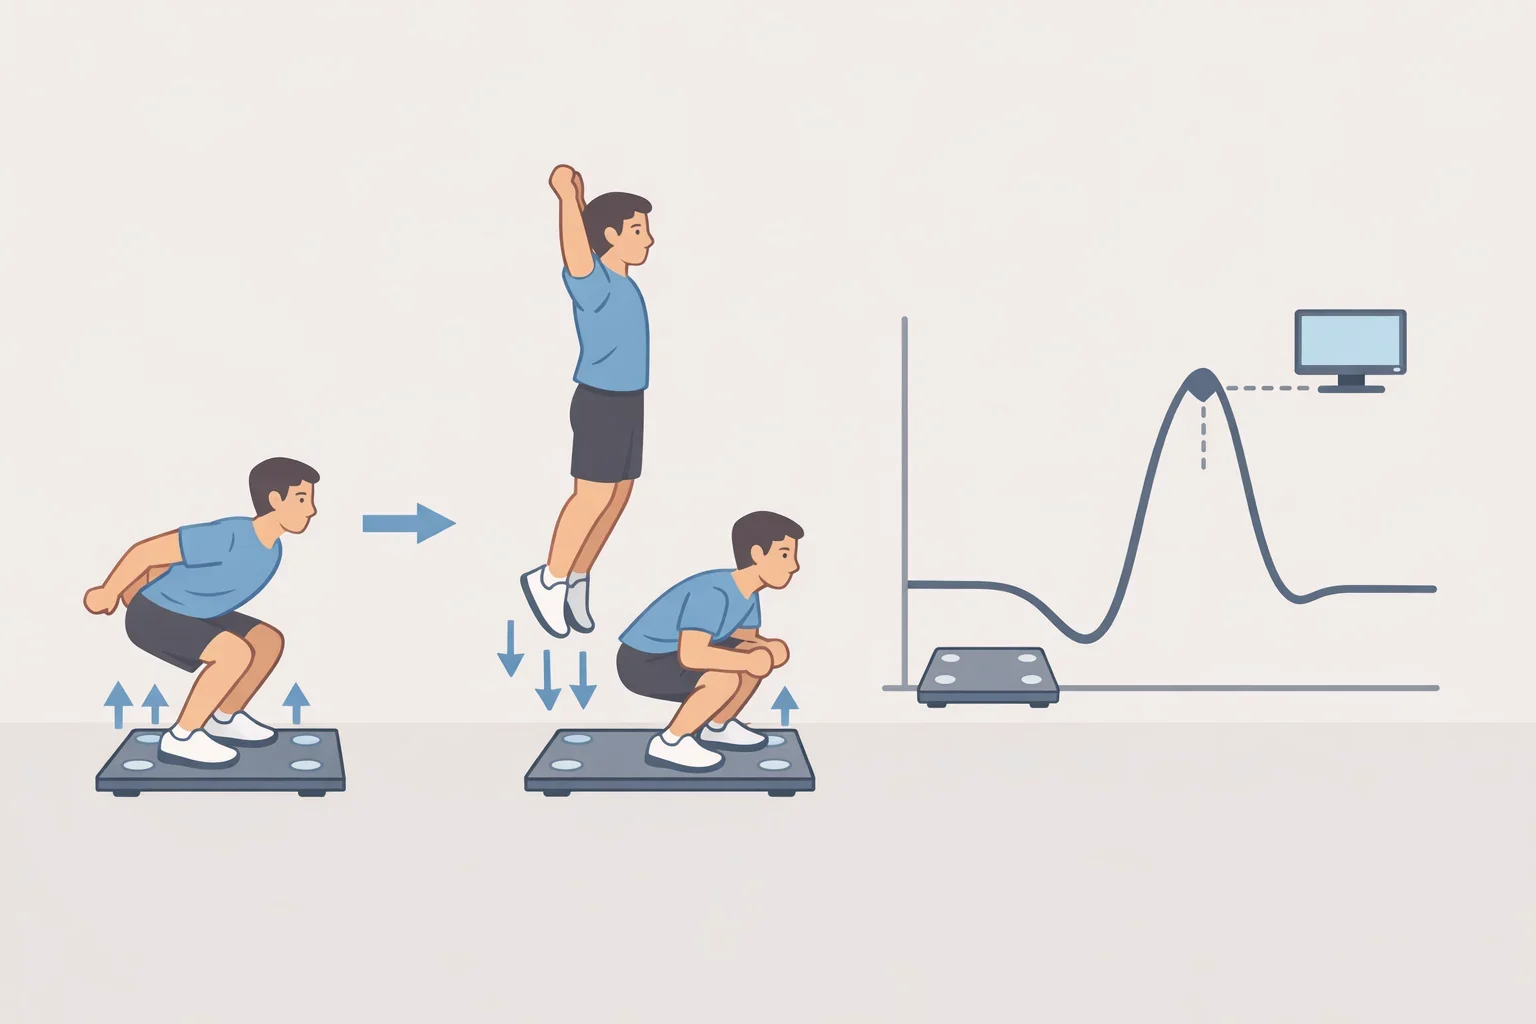
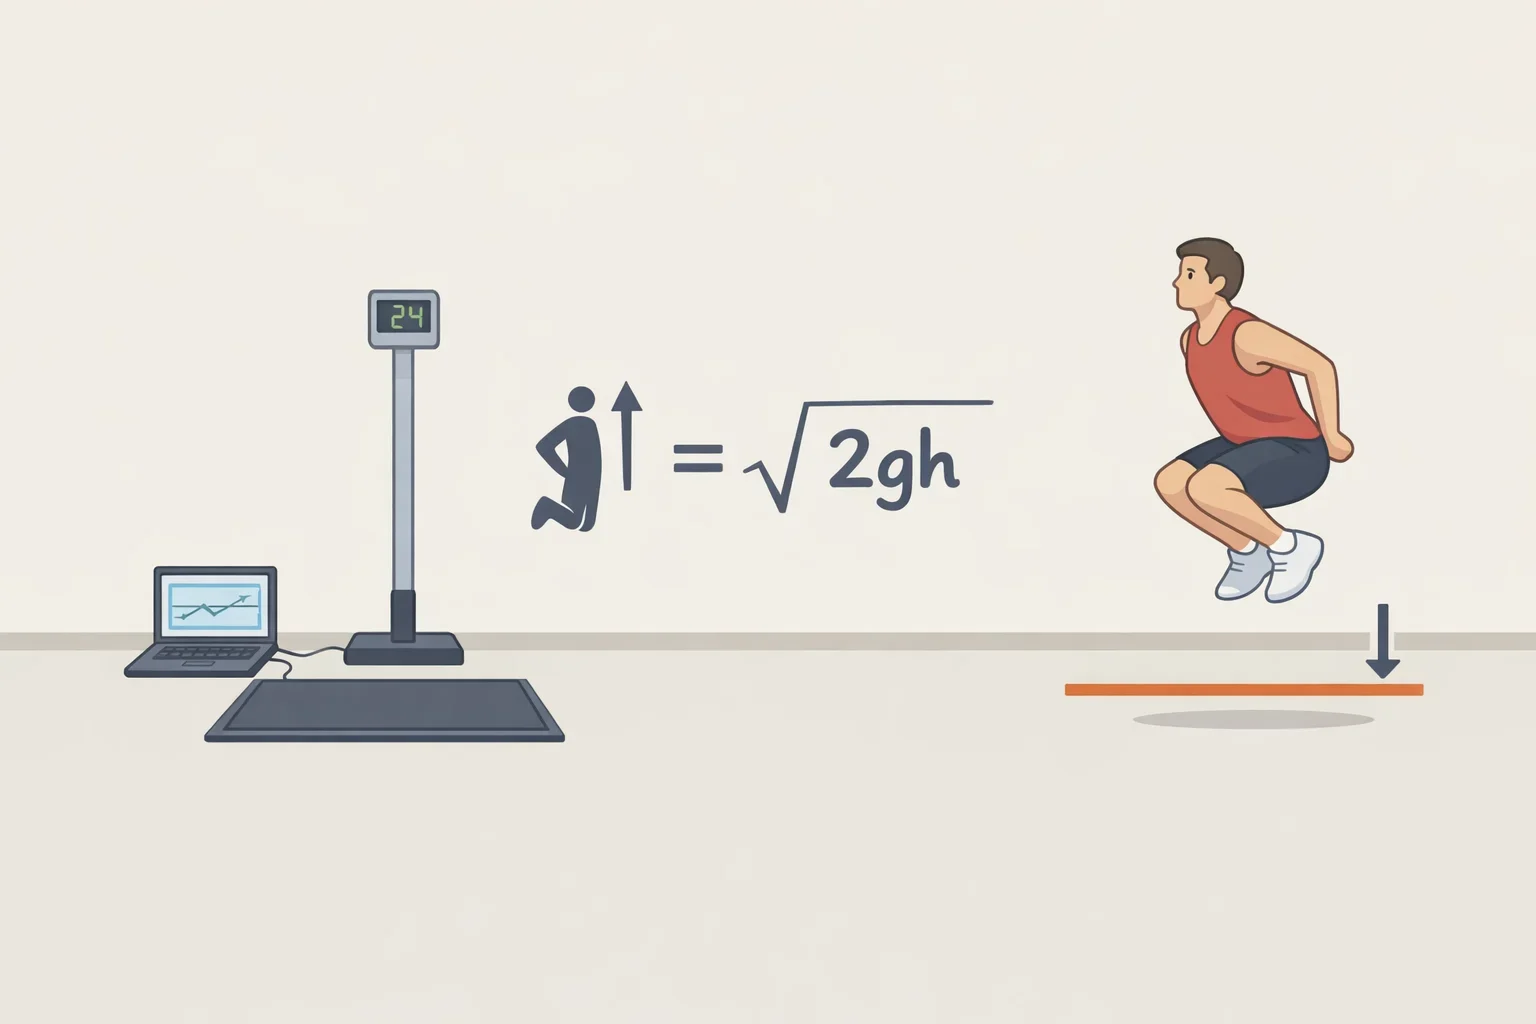
Vertical jump tests, including CMJs, are the most commonly used task in the reviewed fatigue research, spanning both team and individual sports, according to the systematic review. In a CMJ, the athlete drops quickly into a squat and drives upward off the plate. Sensors built into the platform track the resulting ground-reaction force throughout the movement, producing a curve that shows how force builds, peaks, and drops rather than a single output number.
Force platform testing has grown more common because vertical jump tests are simple and time-efficient, and because the technology has become easier to use across a wider range of settings (jump height review). Beyond jump height, a force plate can output braking force, propulsive force, and movement time. Running two plates side by side, the way the Division I volleyball study did, produces separate left- and right-side force data (volleyball study).
That kind of output has a use beyond research settings. The soccer study's authors noted their force-time data can help sports coaches and strength and conditioning coaches decide how to structure training in the days after competition (soccer study).
Force plate fatigue monitoring: what recent studies show
Reading fatigue off a force plate isn't standardized. The systematic review found that fatiguing protocols, test tasks, equipment, and variables differ widely across the research base, concluding there's no single agreed-upon method for assessing neuromuscular fatigue (systematic review). Jump height, tracked in 75.0% of that research, and peak power, tracked in 41.3%, come up far more often than any other metric.
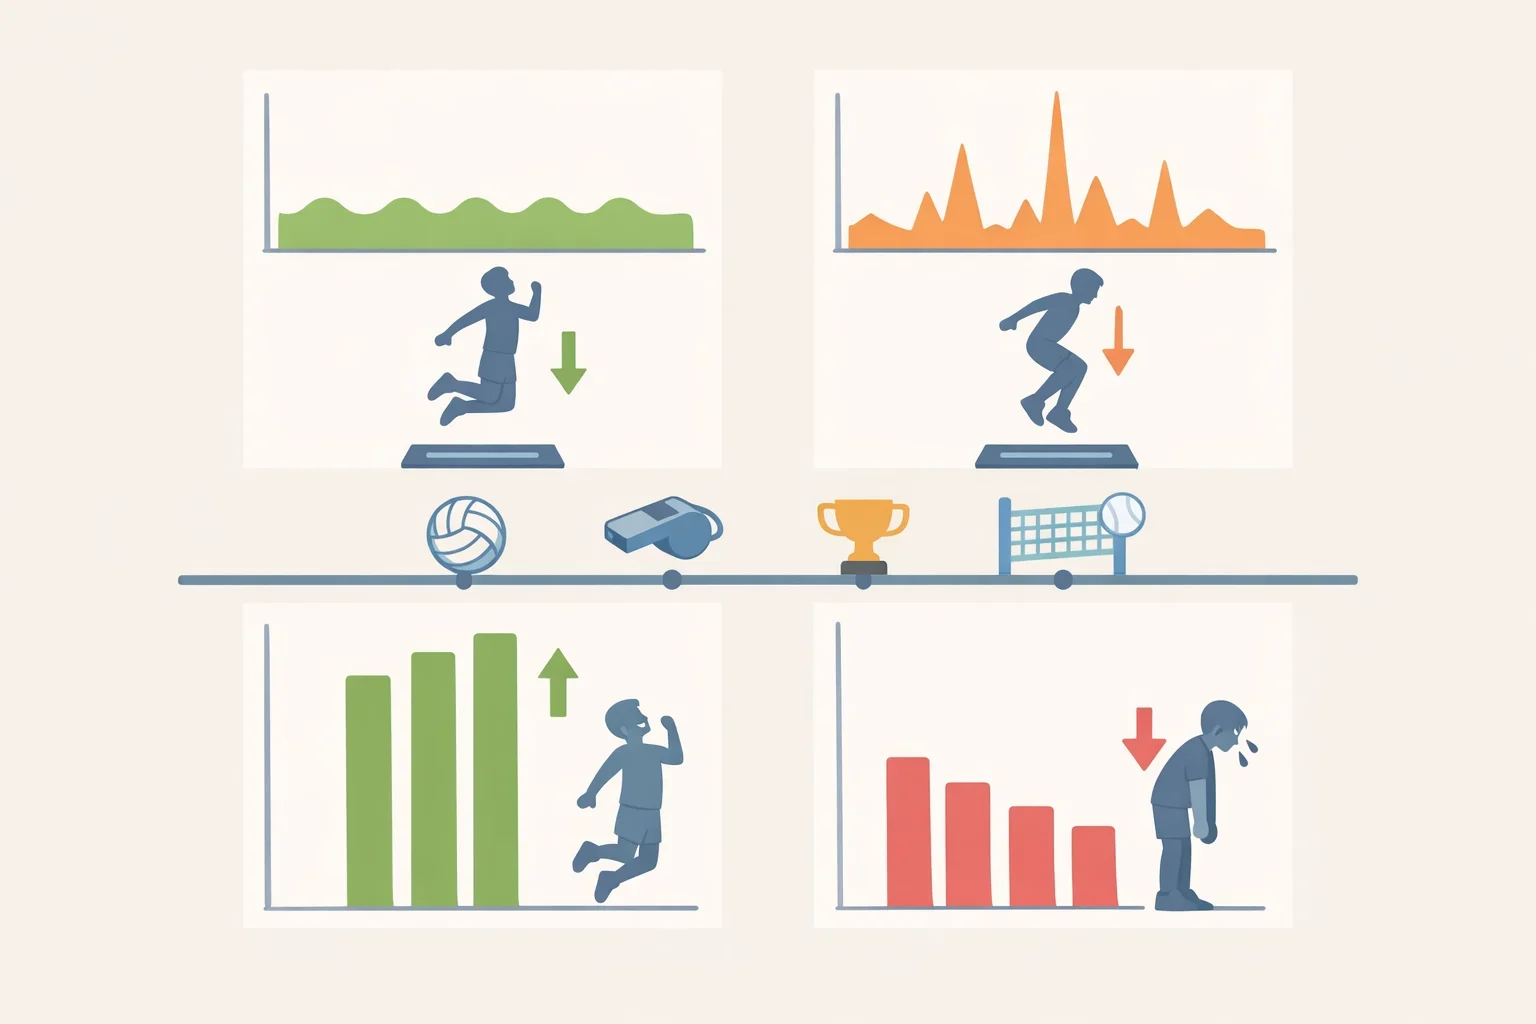
The volleyball study, Individualized Z-Score Classification of Jump Load and Its Association With Countermovement Jump Performance Throughout a Division I Volleyball Season, tracked 14 Division I players across a full season, comparing daily workload spikes against next-morning CMJ performance. Every CMJ variable showed a trivial effect size (ηp² < 0.015), and none of the correlations between workload and jump performance reached significance (P ≥ 0.130). The researchers concluded that typical in-season workload swings for this group may not be enough to disrupt neuromuscular status in a way CMJ testing can detect.
The soccer study, Changes in Single Leg Countermovement Jump Force-Time Characteristics Pre, Post and 2 Days Postmatch in Elite Girls' Youth Soccer, followed elite girls' youth players across eight competitive matches. Researchers found statistically significant, trivial-to-small increases in jump height and selected relative braking and propulsive-force measures immediately after matches, and similar trivial-to-small increases in jump height and jump momentum two days later, compared with pre-match baselines. Playing time showed no meaningful relationship with those changes (r ≤ 0.20). The sample was small and specific to one elite youth team across eight matches; the result doesn't mean matches improved performance or that second-day recovery sessions are unnecessary, only that a single match may not create enough fatigue stimulus for CMJ testing to pick up. Given the rising physical demands and injury risk documented in girls' soccer, the study's authors suggested coaches consider replacing second-day recovery sessions with strength and high-intensity training, a recommendation specific to their sample rather than a general prescription (soccer study).
Neither study finds CMJ testing incapable of flagging fatigue. Both show that sensitivity depends on the sport, the population, the workload intensity, and the testing window, which is why the protocol variation documented in the systematic review makes broad claims about "measuring fatigue" hard to trust without checking the specific study behind them.
Why the same jump can produce different numbers
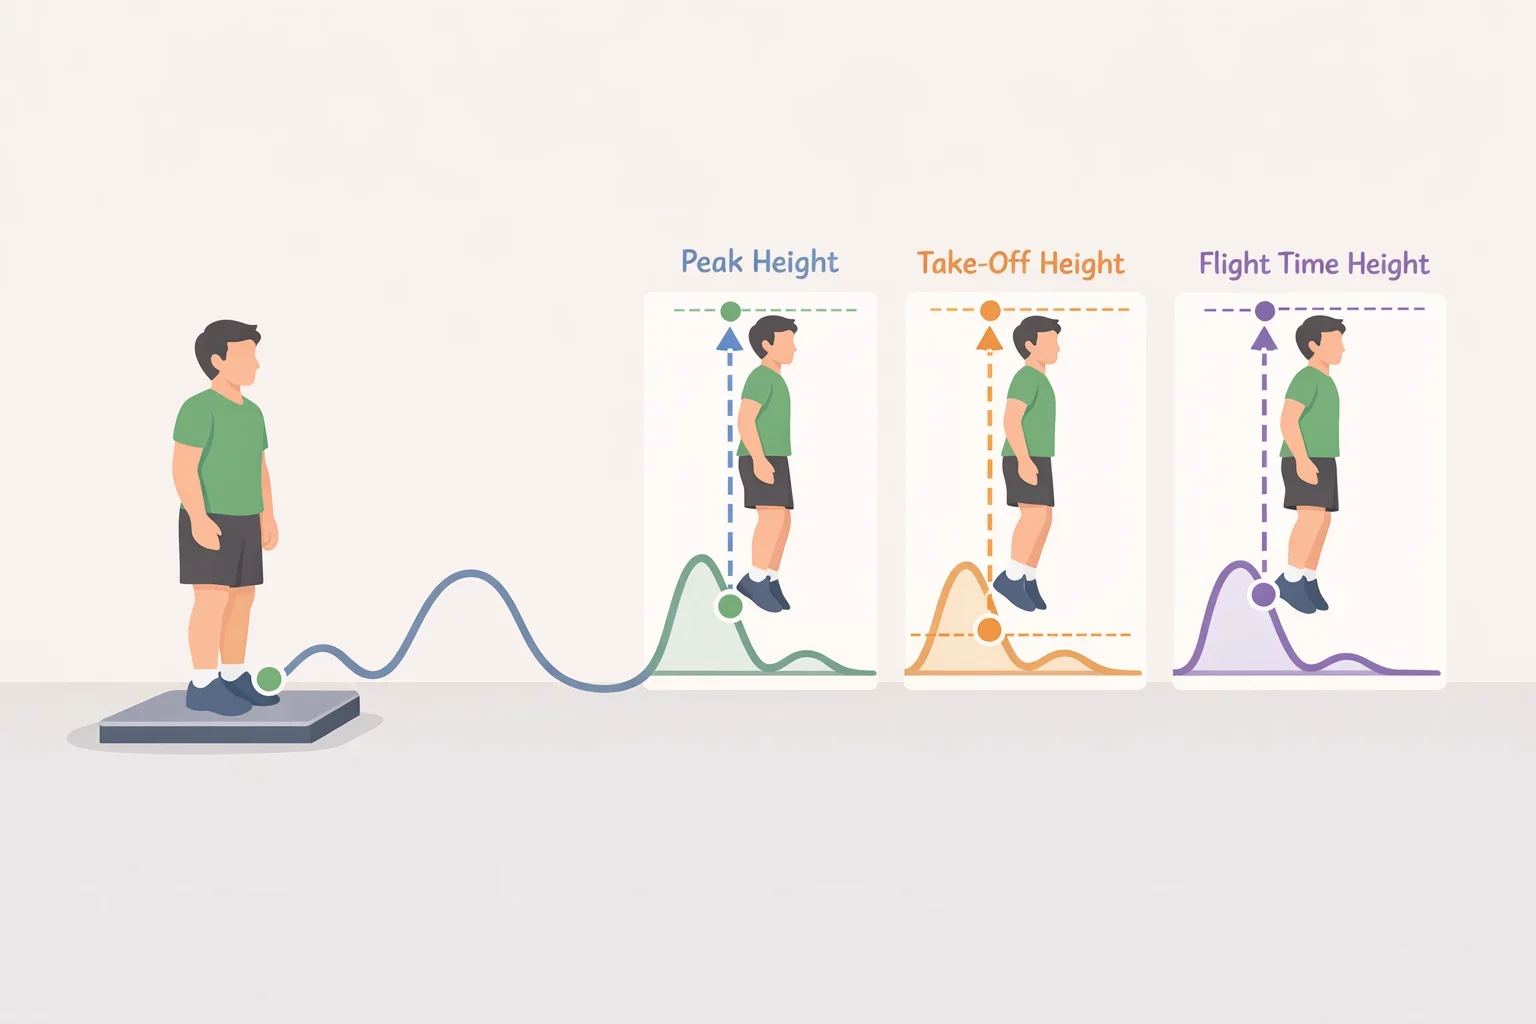
Even a metric as simple-sounding as jump height isn't calculated one universal way. The jump height review identifies four equations commonly used to estimate jump height from force-plate data, and applying different equations to the same jump can produce estimates that differ by roughly 15 centimeters. The jump type, the reason for testing, and how the program defines jump height should determine which equation applies, though most athletes never know which one is running behind their testing software.
Take-off detection settings add another layer. A 2024 study, Comparison of Different Take-off Thresholds When Assessing Vertical Jump Performance, compared six take-off thresholds and found each one was individually reliable, with intraclass correlations of at least 0.835 and coefficients of variation under 10%. Jump height, movement time, reactive strength index, and impulse values still differed significantly depending on which threshold the software used, though the researchers judged those differences trivial by effect size. A metric can be reliable session to session on one system and still shift when the take-off threshold changes.
Some metrics are unreliable on their own, regardless of equipment. The cross-platform comparison, which tested VALD ForceDecks, Hawkin Dynamics, and Sparta Science, found rate of force development and modified reactive strength index showed poor test-retest reliability even during baseline testing, before any cross-system comparison entered the picture. A swing in either number from one session to the next may reflect measurement noise rather than a real change in the athlete.
That same study found acceptable statistical agreement between systems on several measures, but also documented systematic bias: Sparta Science's jump height and reactive strength index outputs ran consistently higher than the other two systems, even in comparisons rated acceptable by concordance correlation coefficients. Those readings may not be directly comparable because the systems use different procedures and definitions and show systematic bias, and the study's authors advise practitioners to understand those inconsistencies before comparing results across systems.
This body of research examined jump-derived metrics specifically, so the findings shouldn't automatically be applied to maximal-strength protocols such as isometric mid-thigh pulls, which involve separate testing considerations best discussed with a certified strength and conditioning professional.
Making sense of a countermovement jump force plate test
The clearest practical guidance comes directly from the cross-platform study: know the inconsistencies in a testing system before comparing numbers it generates (cross-platform comparison). In practice, that means keeping the same hardware, the same jump-height equation, and the same take-off threshold for a given athlete across a season rather than switching systems partway through it.
A single low reading is best treated cautiously rather than as a verdict. The soccer study found CMJ scores rising, not falling, after matches, showing that a jump number moving in either direction from one session to the next doesn't automatically signal a meaningful change in readiness (soccer study). Because even reliable take-off thresholds carry coefficients of variation below 10% (take-off threshold study), a score that looks off is generally more informative compared against that athlete's own prior sessions than read as a standalone result.
A lower score isn't something an athlete should try to diagnose alone. Sharp pain or symptoms that don't improve with rest are reasons to involve an athletic trainer, physical therapist, or team physician, not reasons to keep retesting until the number looks better.
Together, these studies support using force-plate data as context-dependent performance information rather than a standalone fatigue diagnosis. Compare results only within one consistent system and protocol, and raise any concerning symptoms with athletic training or medical staff rather than running the test again.